Aug 21
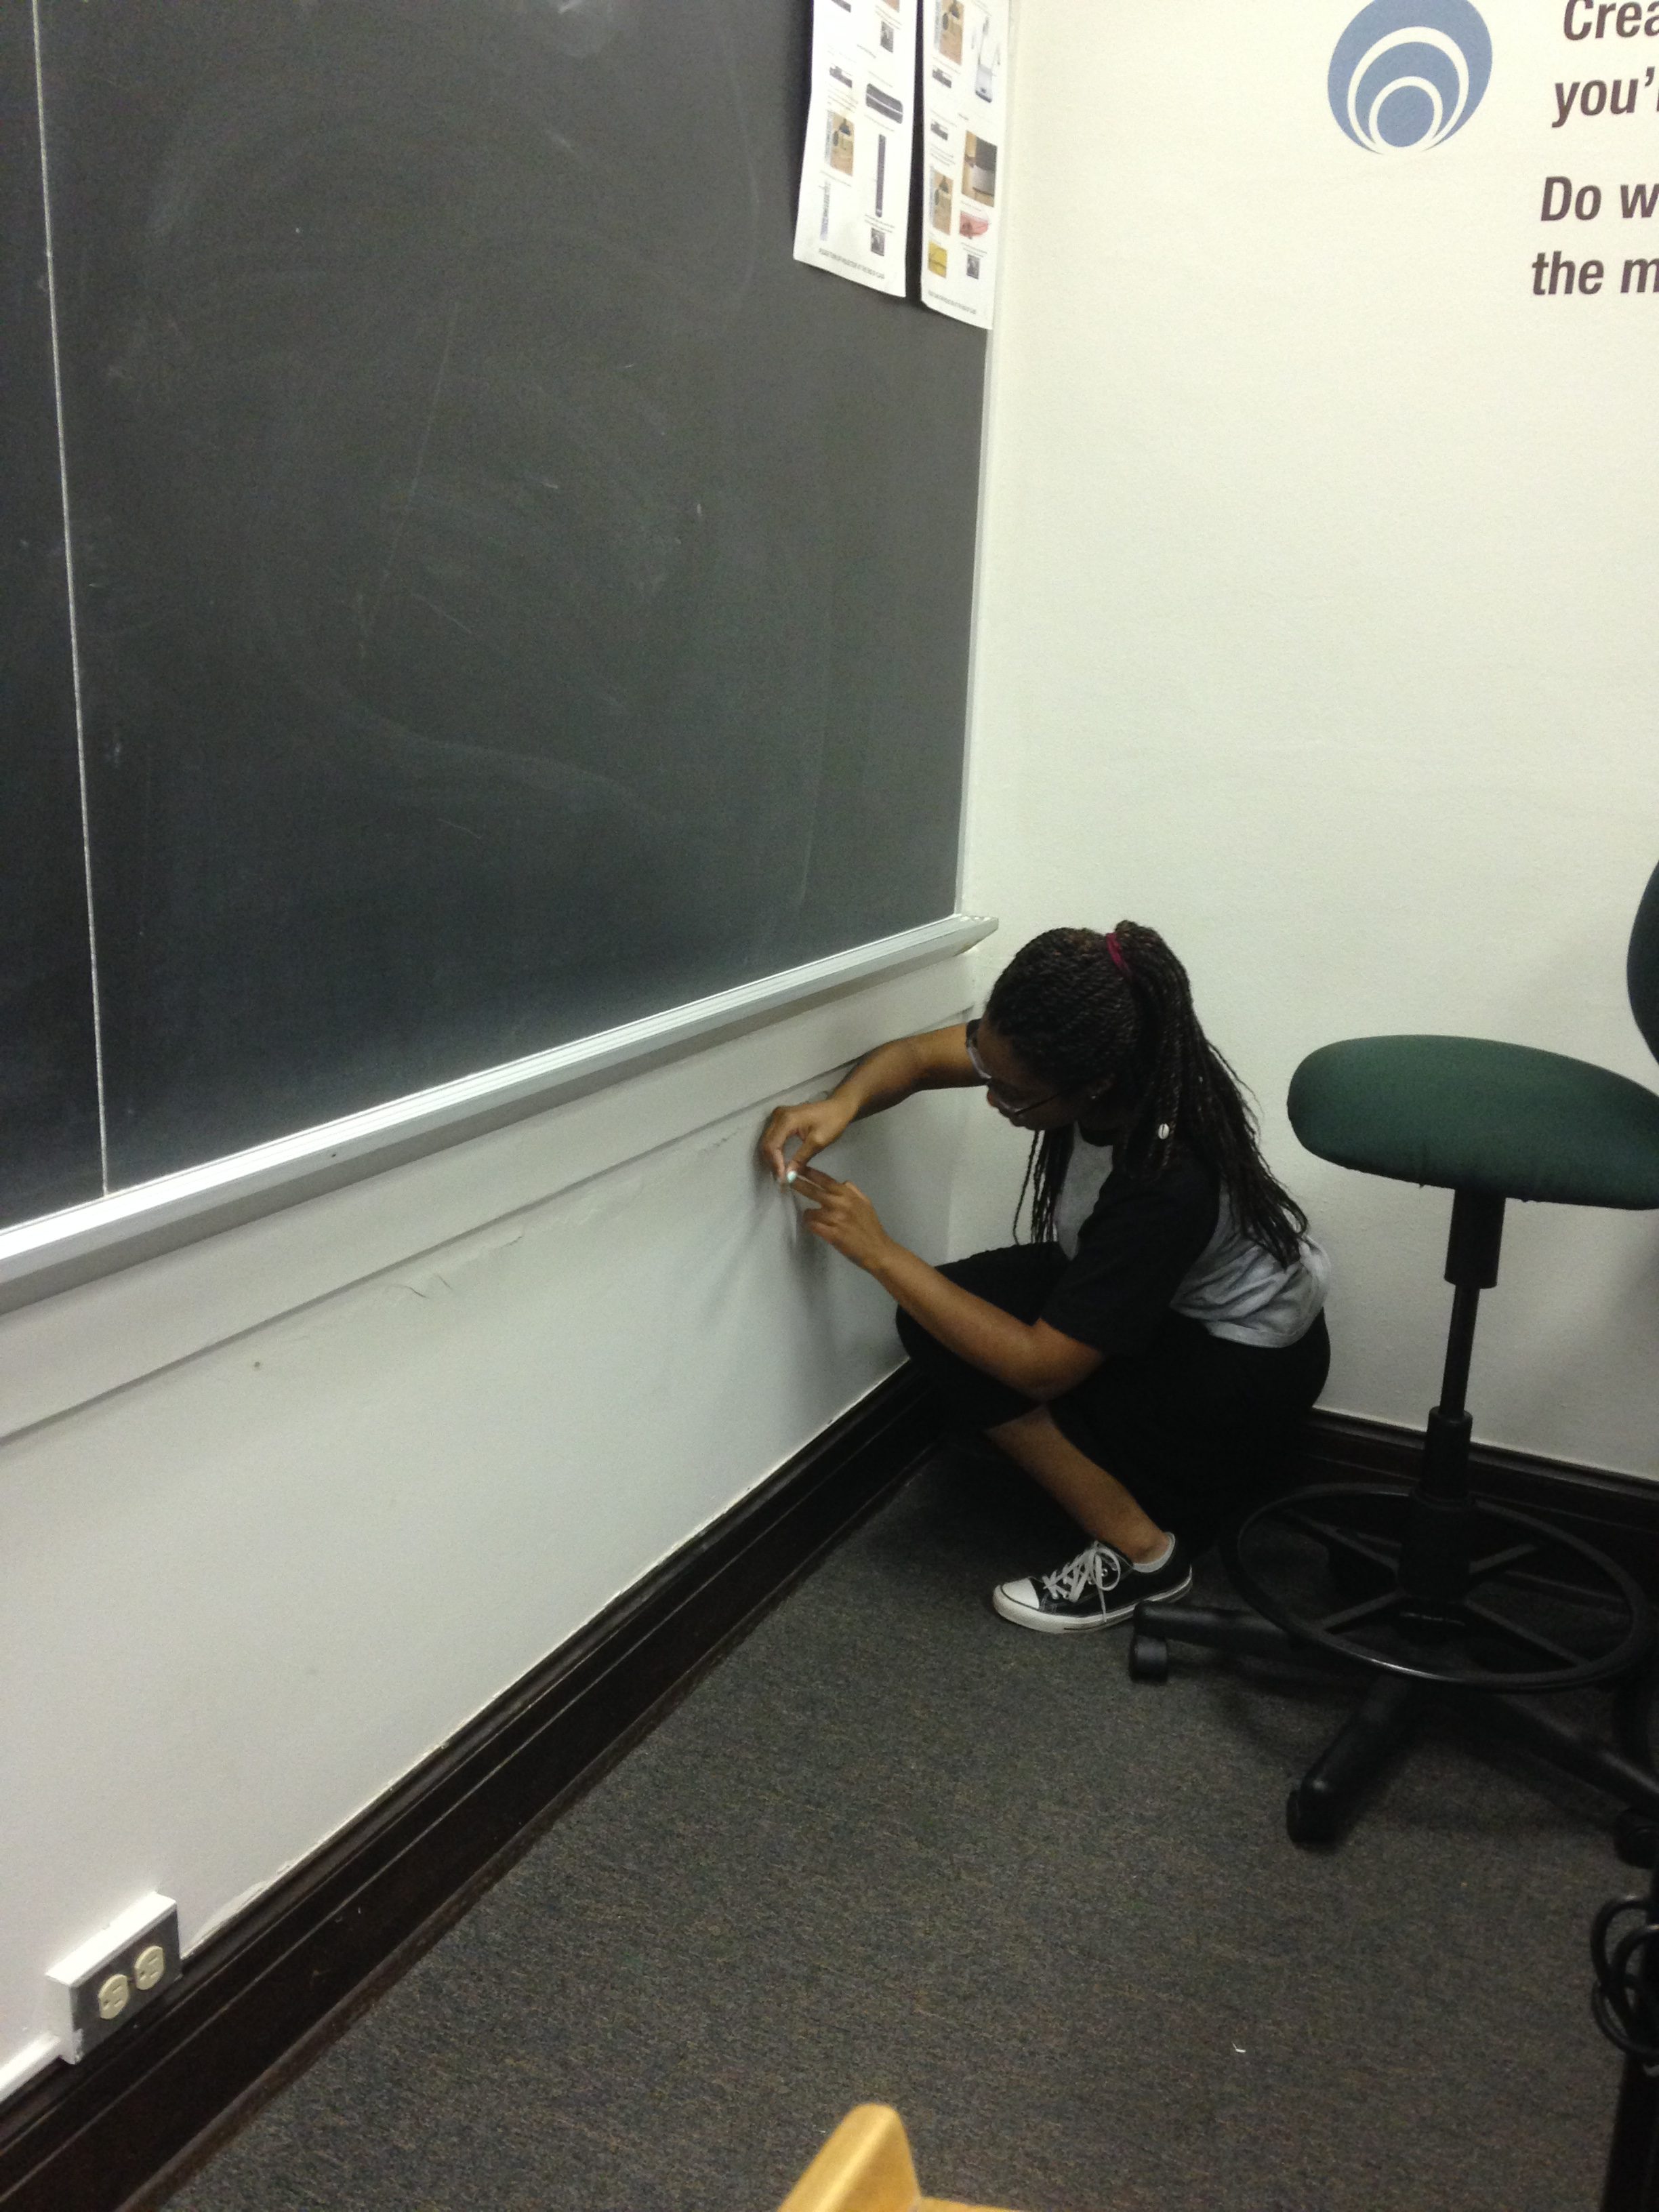
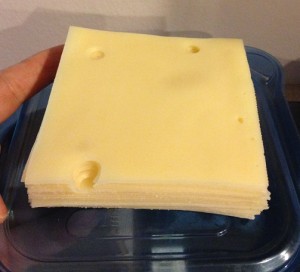
The skills of estimating and performing unit conversions are useful in mathematics at many levels as well as in many scientific situations. The estimation challenge works on both of those important skills. In this challenge students are asked to answer odd questions such as “How many slices of Kraft American cheese would it take to wallpaper this room?” The goal is not to get the “exact right answer” but rather to determine the magnitude of the answer (the power of 10 part when expressed in scientific notation). This gives a sense for how big the quantity is.
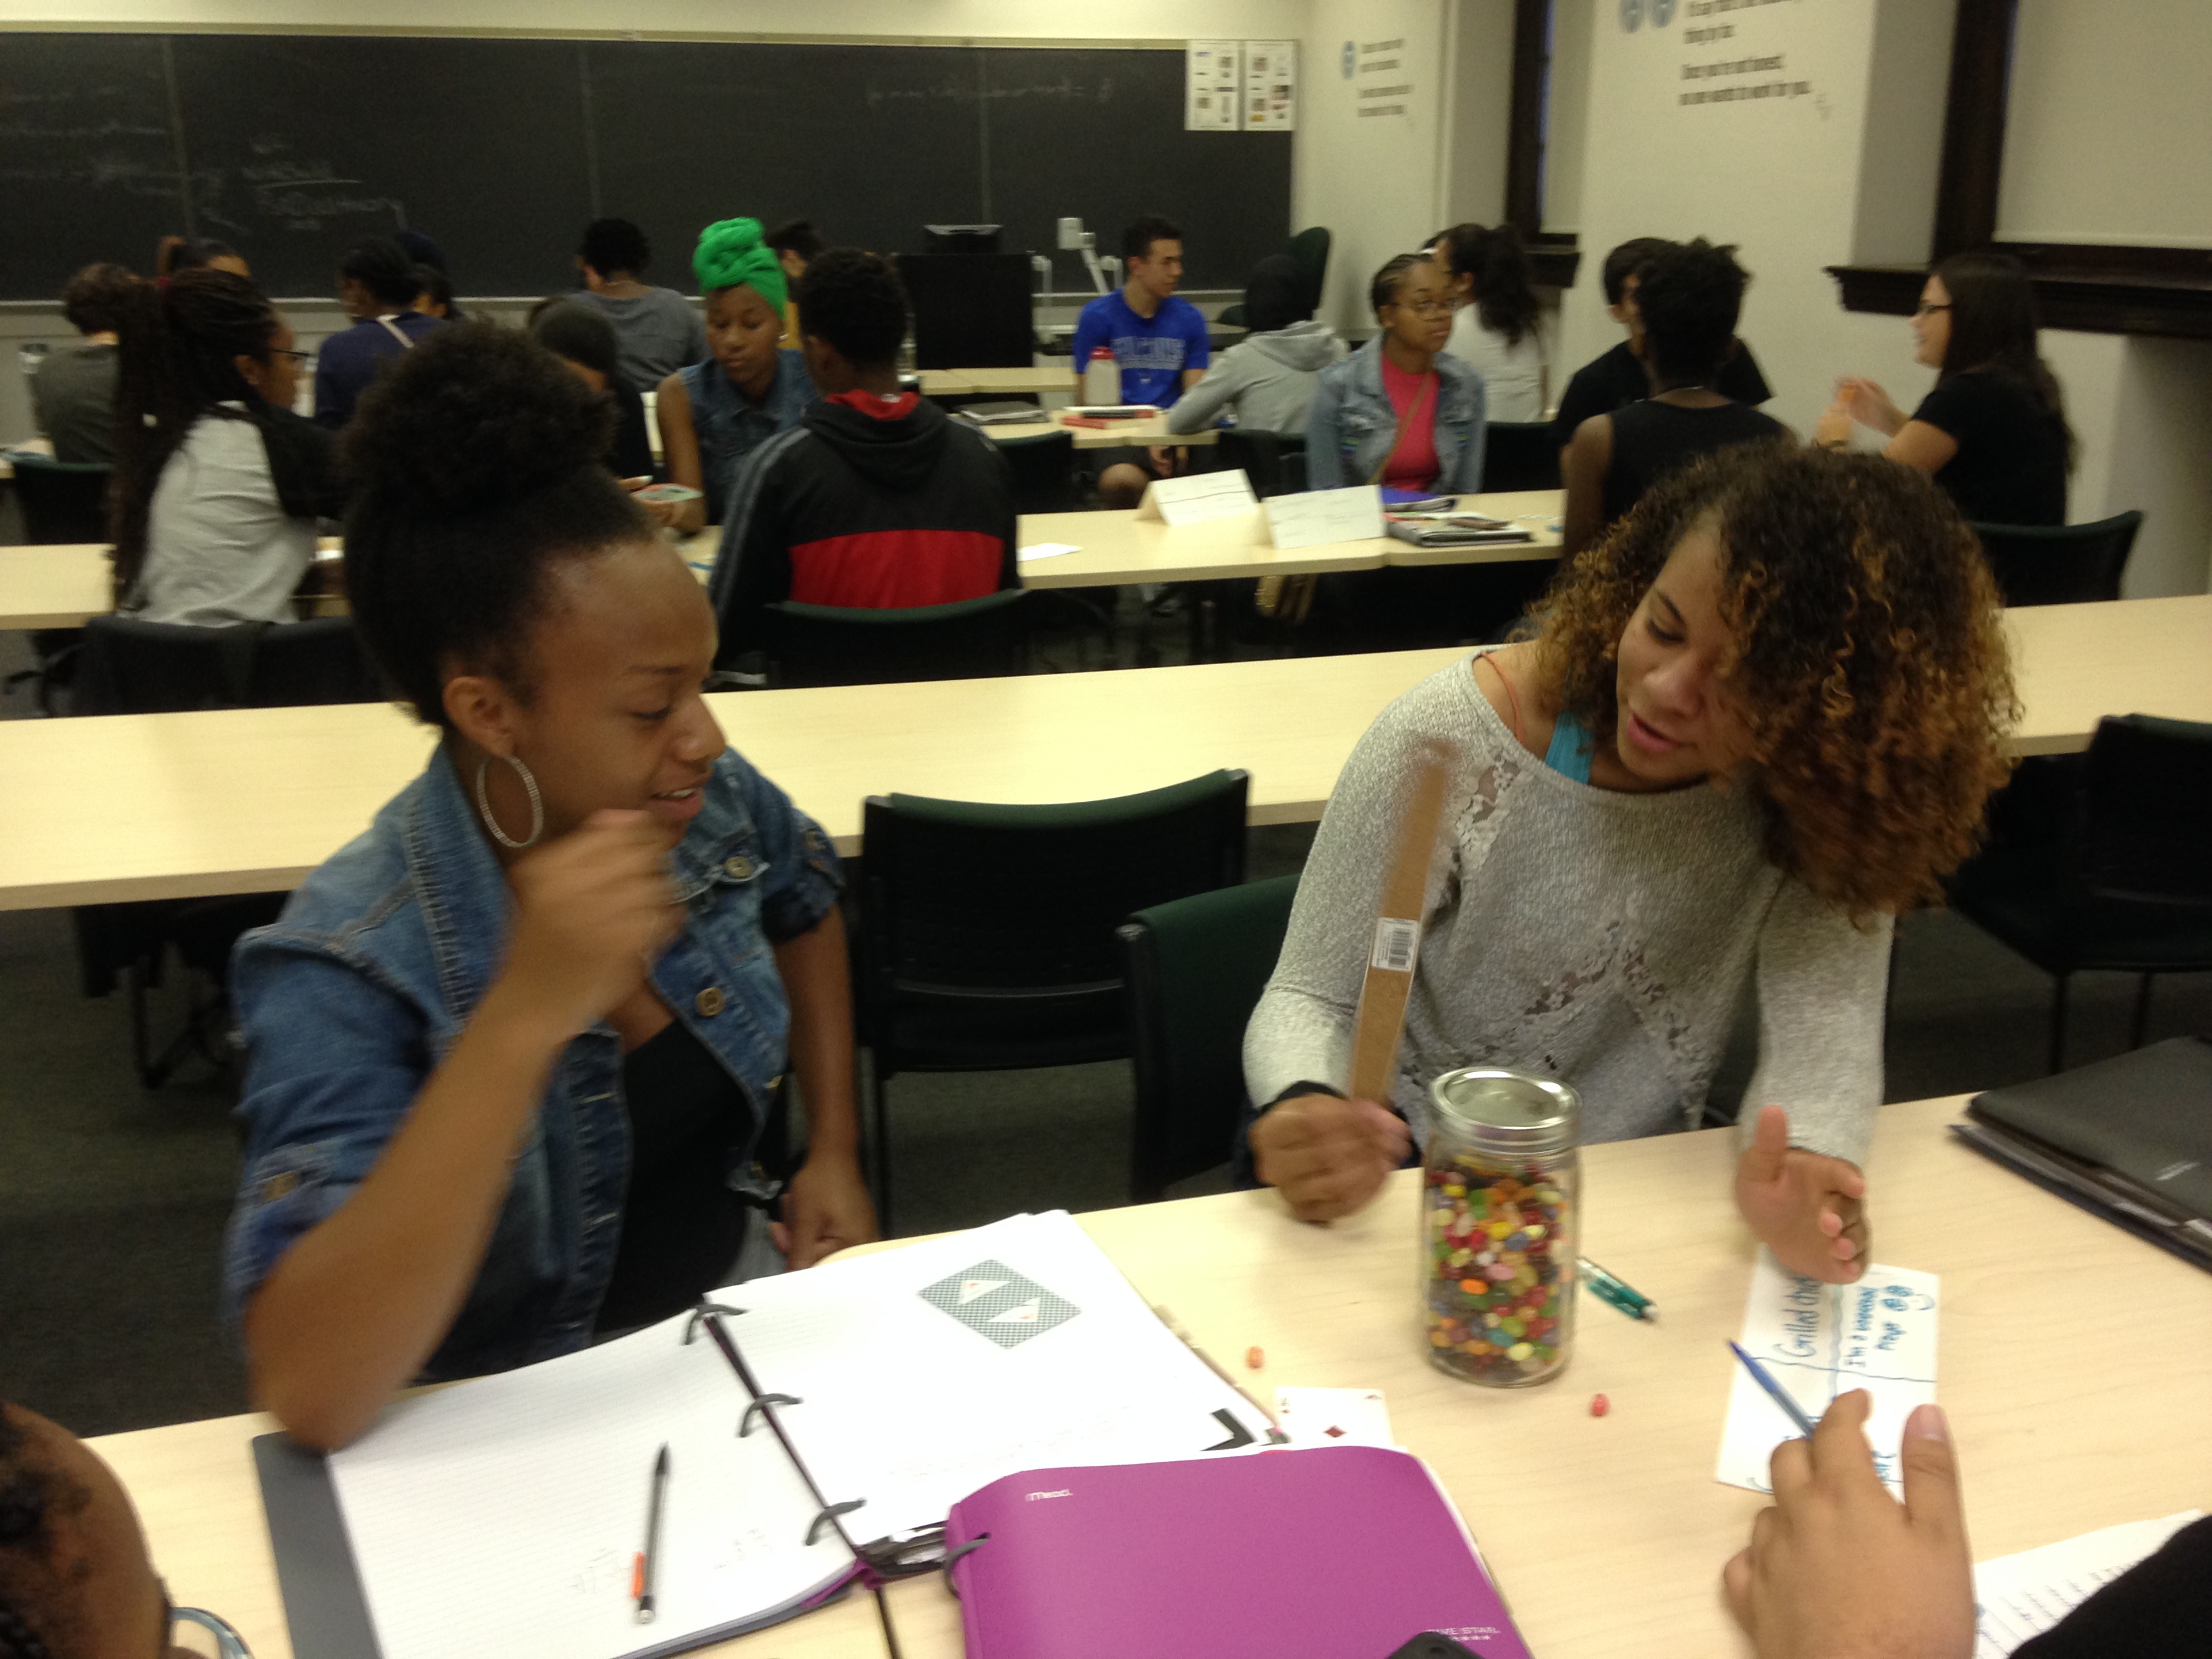
After all groups had estimated their answers, we compared answers and discussed any questions the students had.
Here is the text of the Order of Magnitude Estimation challenge:
******************************************************************************************
ORDER OF MAGNITUDE
Work out your estimations on scrap paper, and record the ten-to-a-power part.
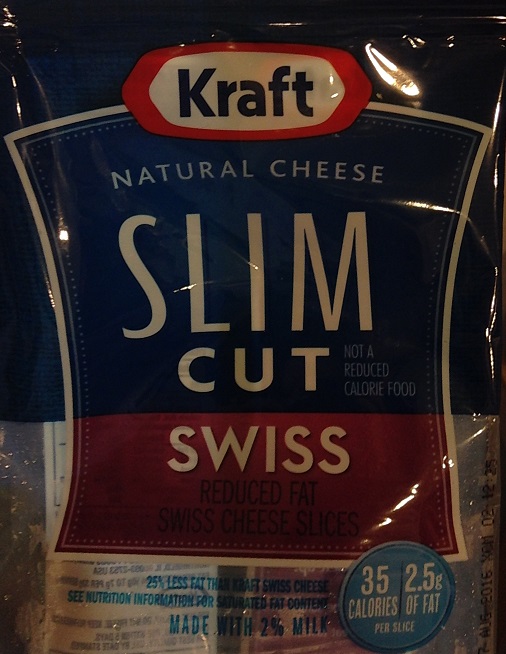
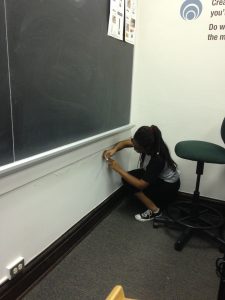
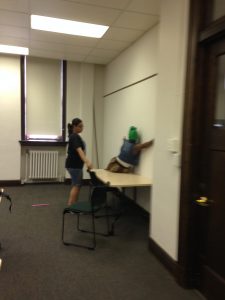
1. How many slices of Kraft American cheese would it take to wallpaper this room?
2. How many cherries would fit inside the four tires on a school bus?
3. How many gallons of water would it take to fill this building?
4. How many pounds does the ancient statue The Sphinx weigh?
5. How many dollar bills laid end-to-end would it take the reach the Sun?
6. How many kernels of corn are in full square mile cornfield?
7. How many poker chips would it take to fill the High Bay at UDM?
****************************************************************************
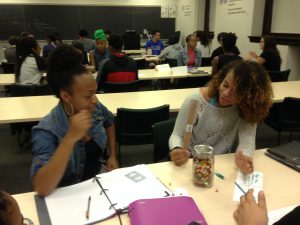
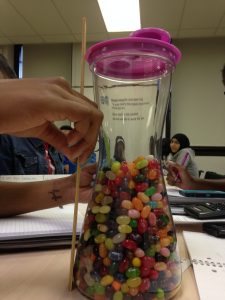
The Order of Magnitude Estimation Challenge was developed by a colleague of mine (Dr. Jeffery Boats) here at the University of Detroit Mercy. He designed the activity as part of the mathematics content of a summer experience for incoming freshmen. This activity along with some jelly bean estimation, were the first of four days of mathematics content. The student participants in the summer experience are planning a variety of majors in biomedical fields. Funding for the summer experience is provided by the National Institutes of Health (NIH) as part of a $21.2 million dollar grant over a five year period. For more information about the grant and the summer experience, visit rebuildetroit.org.
One of the challenges of teaching mathematics to this group is the wide variety of mathematical backgrounds and placement scores the students come in with (anywhere from developmental math to calculus 2). It is important to provide activities which engage all students without overwhelming or boring anyone. The solution devised by the mathematics department is to present topics that are off the beaten track or that recur in many courses. This estimation challenge isn’t a part of any standard course and also uses the skills of number sense/estimation and unit conversions which show up in many courses. As another example, on the fourth day of the mathematics portion of the summer program students used K’nex construction toys to investigate function composition as described in a previous post on this blog
Jun 20
Overview
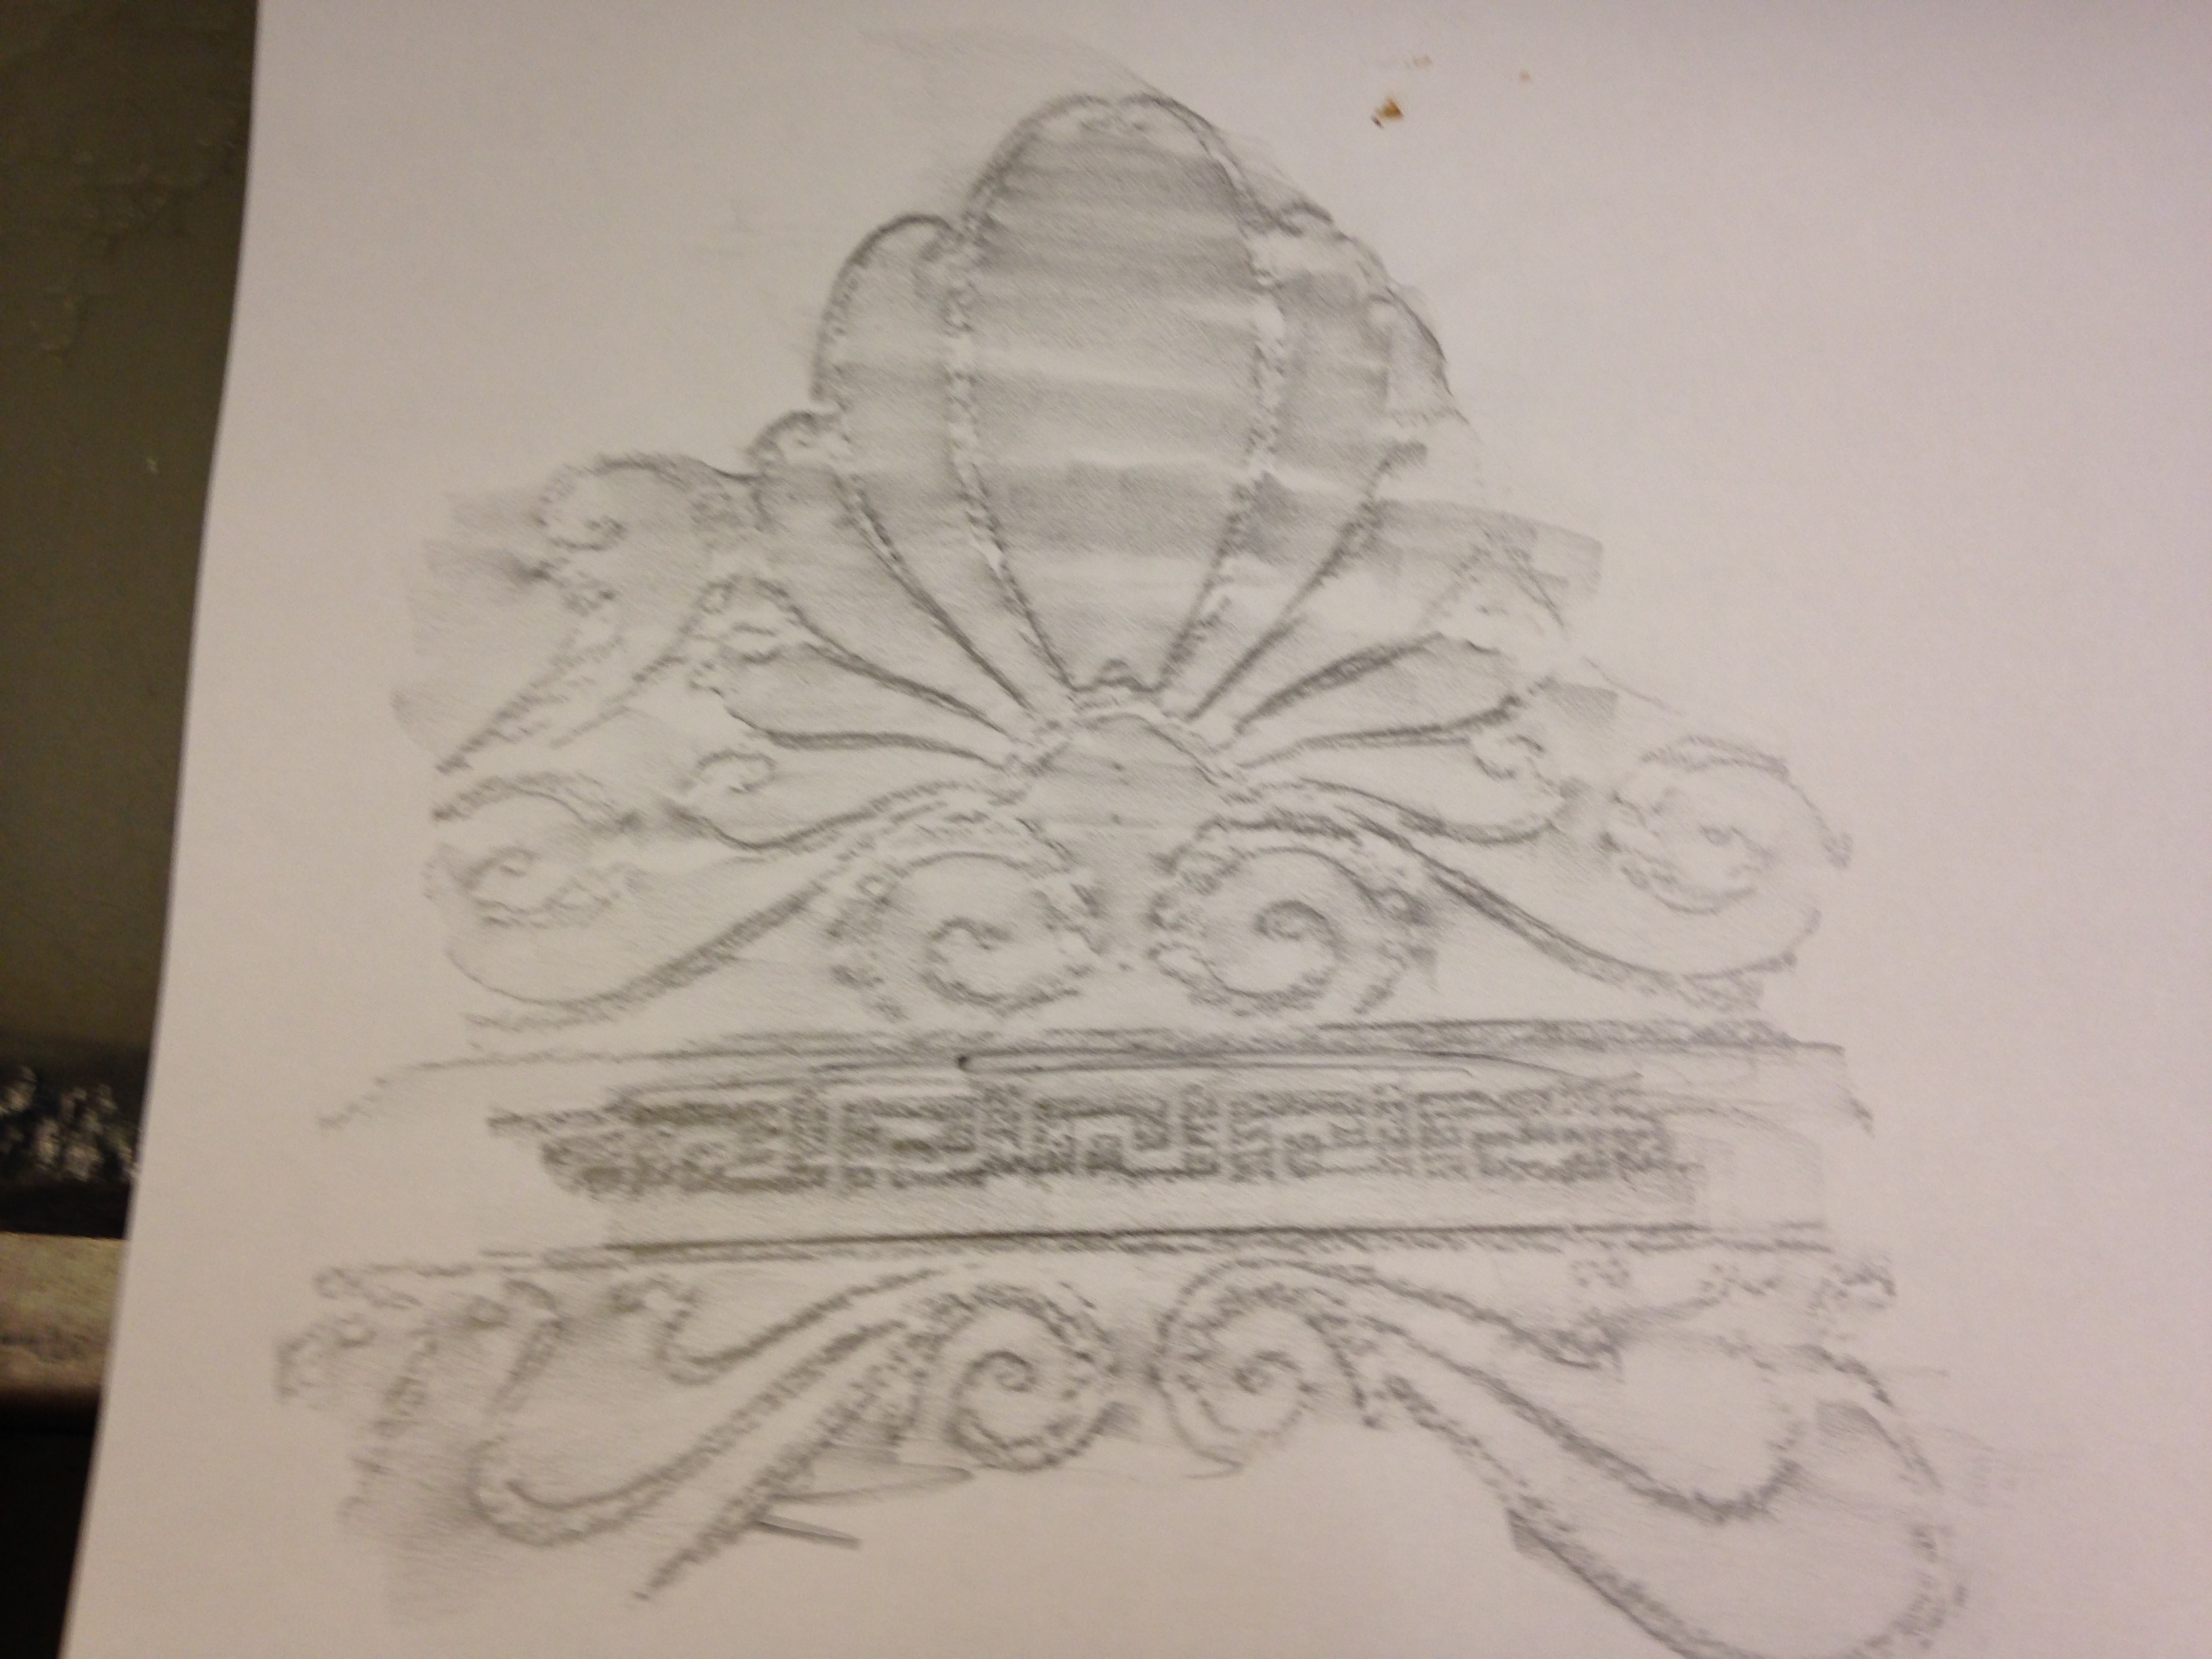
This activity introduces children to the abstract concept of projections from 3 dimensional space onto 2 dimensional space in a concrete and age appropriate way by using rubbings of objects with interesting surfaces. The activity is written for a Kindergarten class, but could easily be adjusted for other early elementary students. The activity takes 30-50 minutes. The main portion of the directions are below, but the full version is here: Rubbings as Projections (including the coin equation handout).
Large group Introduction
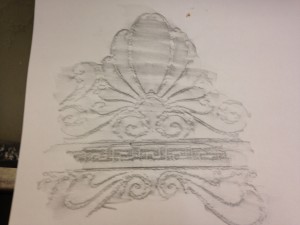
- Demonstrate how to take a rubbing (I used the bottom of my shoe)
- Discuss what information is preserved in the rubbing (tallest portions) and what is lost (color, how far down the lower parts are)
- Discuss three dimensions versus two dimensions. If you can only see one side of something, say the top, you don’t know very much about it. Cone upside down looks the same as a cylinder from the top. Cube and rectangular prism look the same from the top (if the rectangular prism is oriented correctly). If you can only see my back, you don’t know how many buttons my shirt has.
- (optional) Show an object, have students predict what rubbing will look like, take the rubbing and discuss (possibly do this two or three times)
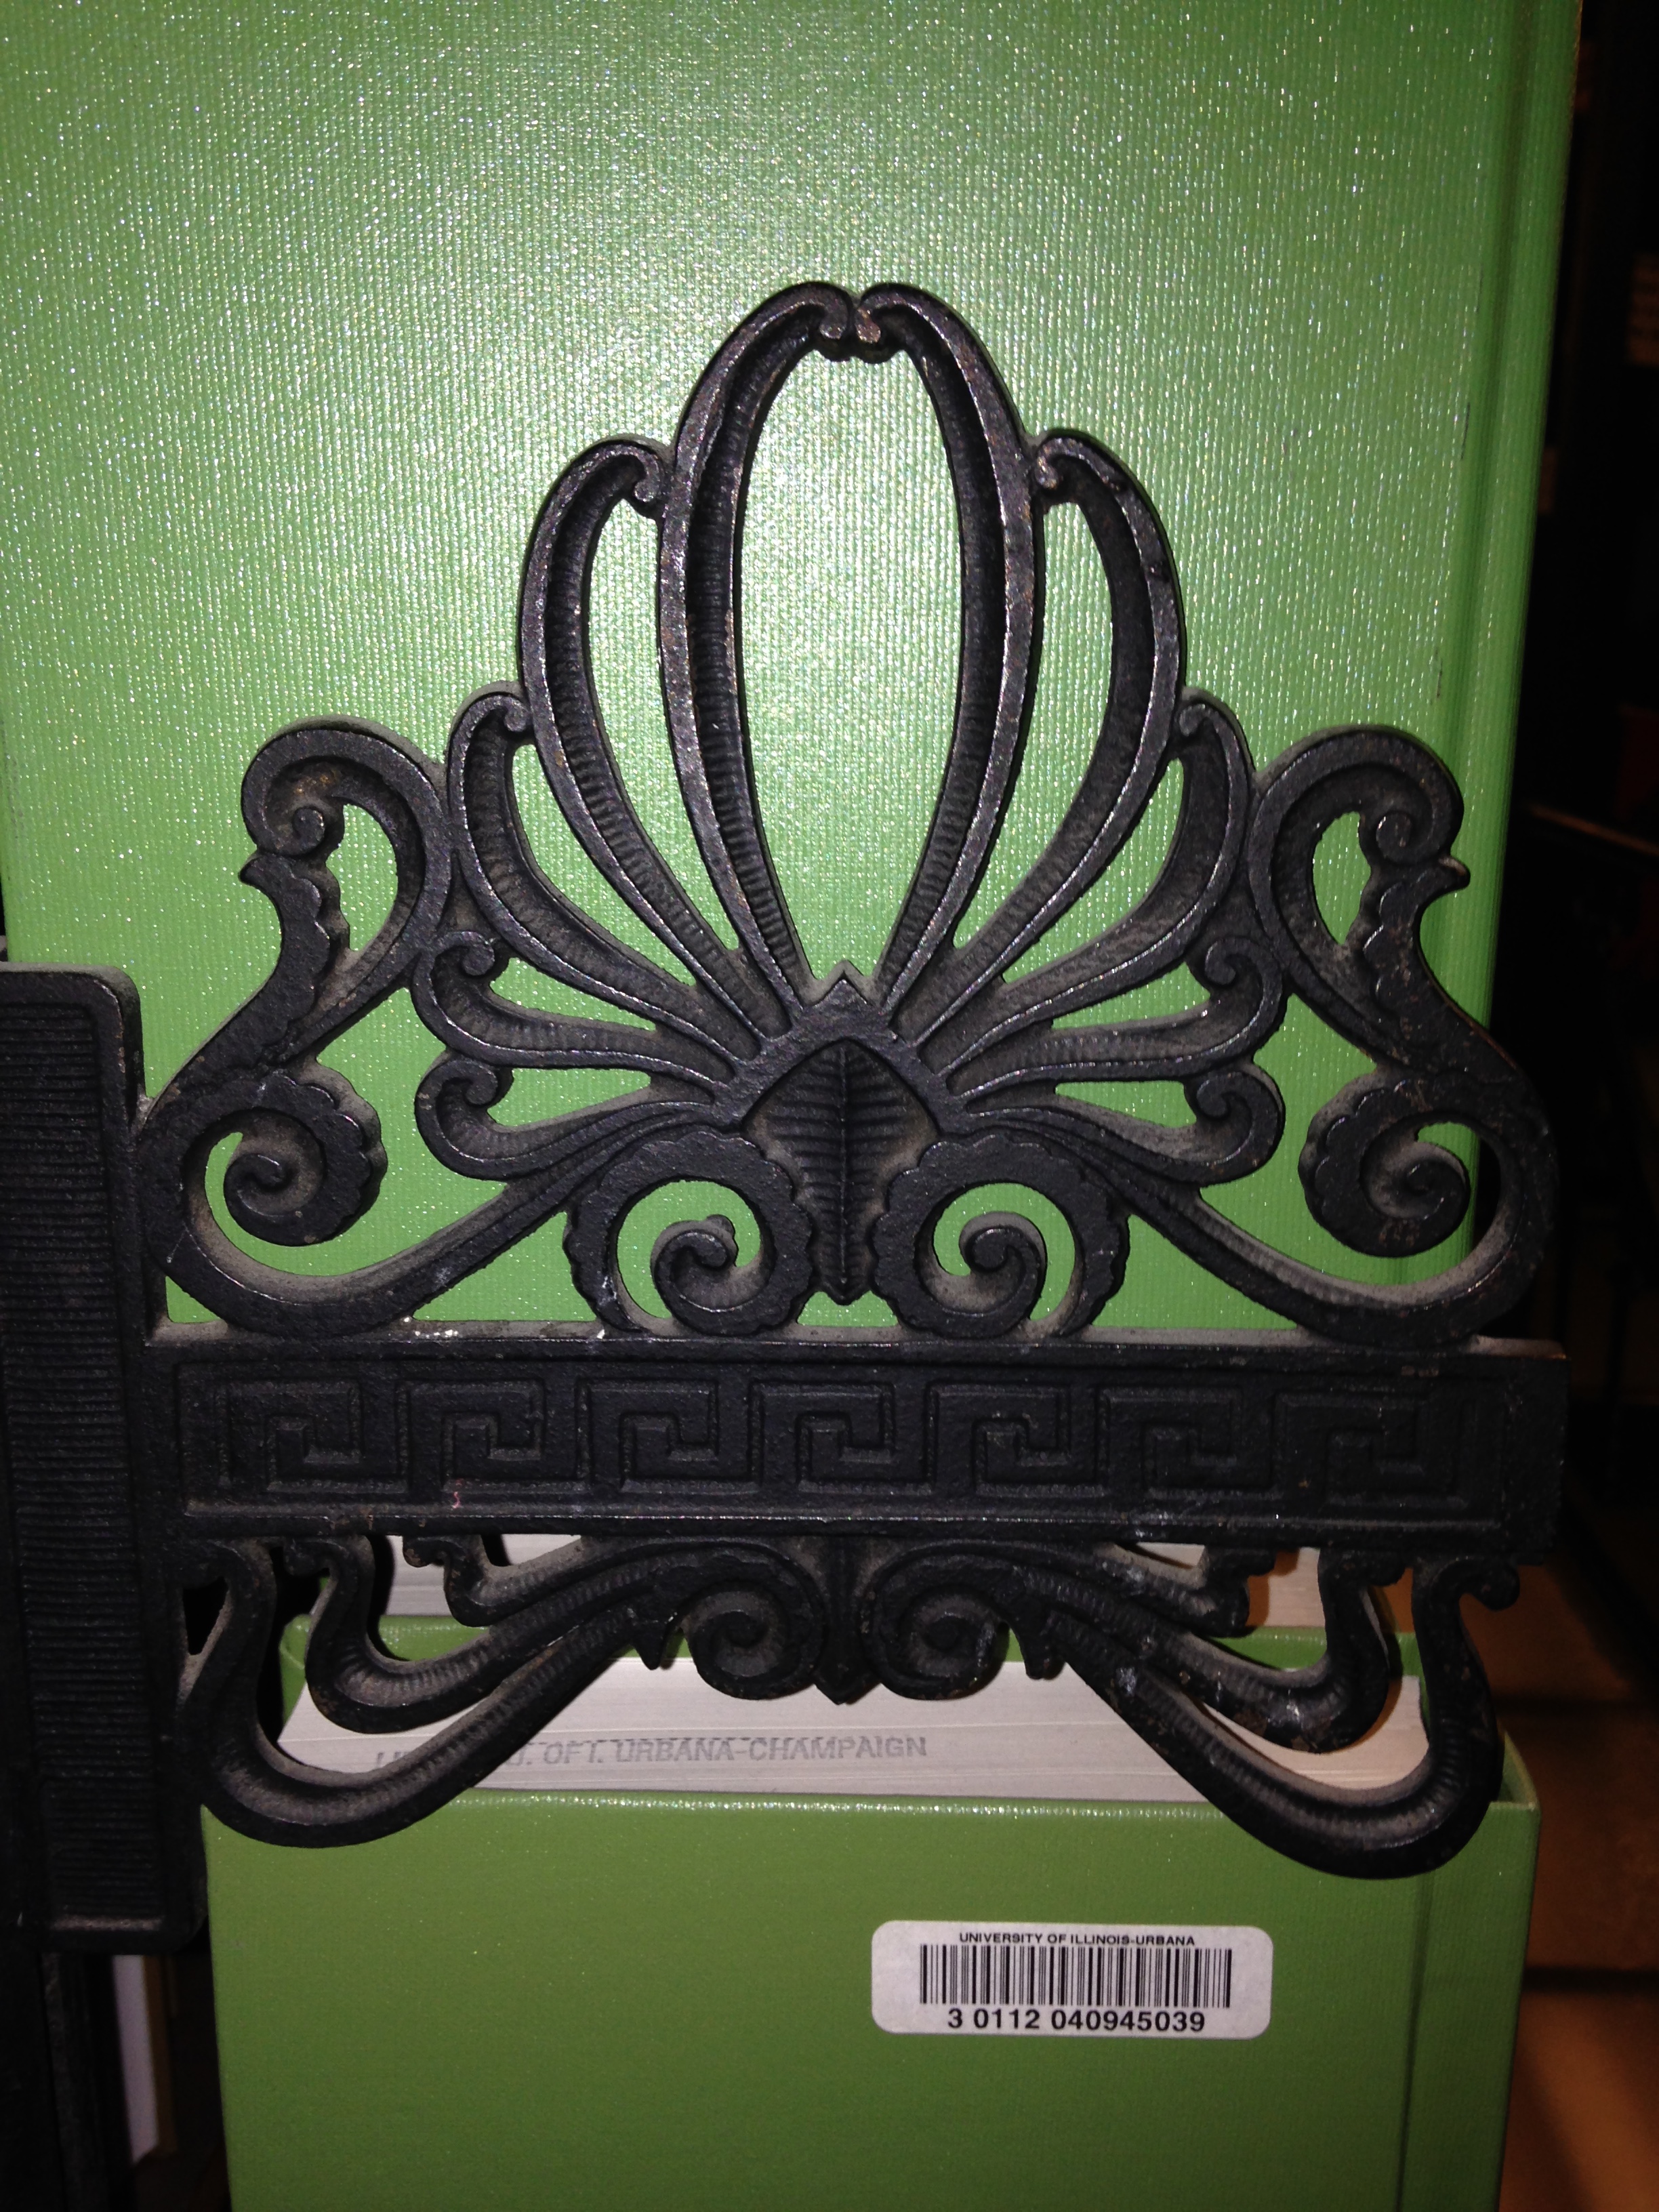
- Get out the matching cards (RubbingsAsProjections-MatchingCards). Pass out the pictures of the rubbings to groups of students Show the pictures of the objects one at a time on the Elmo/smart board/by holding them up. Students should try to pick out the picture of the rubbing that goes with the object. Here’s a sample pair:

Small group “centers” done in rotation (pick four to do-I think the first four are the best)
- Doing Rubbings-each student should make a rubbing of the bottom of their shoe.
- Tallest Portions-cut off and look at the tallest portions of Swiss Cheese, an apple, carrot with the greens still attached, angel food cake, loaf of bread, pear, or similar food objects. Draw a picture. (“Remember a rubbing is basically taking the top layer of something, so at this station we are going to cut off the top layer of some food.” First I cut the top off the apple (using a kiddie safety knife), “what does this top layer tell us about the rest of it?” Then used the corer slicer to cut the apple into 3 wedges which the students ate. Then I help up a small piece of the carrot leaves. “What do you think this is the top layer of?” Students knew it was a plant, but didn’t know which one. Then I got the carrot out of my bag and talked about how the top layer was very different from the main part. Some students wanted to try the carrot too. For the Swiss cheese I used a package of thin sandwich slices, which I carefully stacked up into the original block they would have come from.
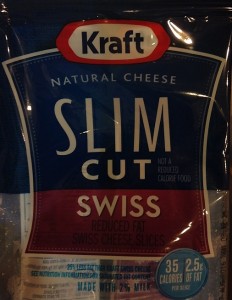
 “What would it look like if I cut off the top layer of this?” “Is this more like the apple or the carrot?” Students also wanted to try the Swiss cheese. I gave each only a quarter of a slice. Many students didn’t like it, so I said to spit it out and congratulated them for trying something knew).
- Memory- Play concentration/memory with the matching cards. The matched pairs are the picture of the object and the picture of the rubbing.
- Coin equations-Rubbings of coins to make equations with gray and orange crayons-see attached handout.
- Rubbing Predictions-Given several interesting objects predict what the rubbings would look like and then take rubbings.
- Self Portrait—Have the students think about what their top layer is and the draw a picture of what they would look like as seem from above. It may help to have group members take turns sitting on the floor for a few seconds so others can see what they look like from that angle. (My hunch is this is too hard for Kindergarten, but could work for older kids).
Sep 22
Here are two problems I used in my calculus 1 class, just after teaching them the definition of the derivative and discussing average and instantaneous rates of change.
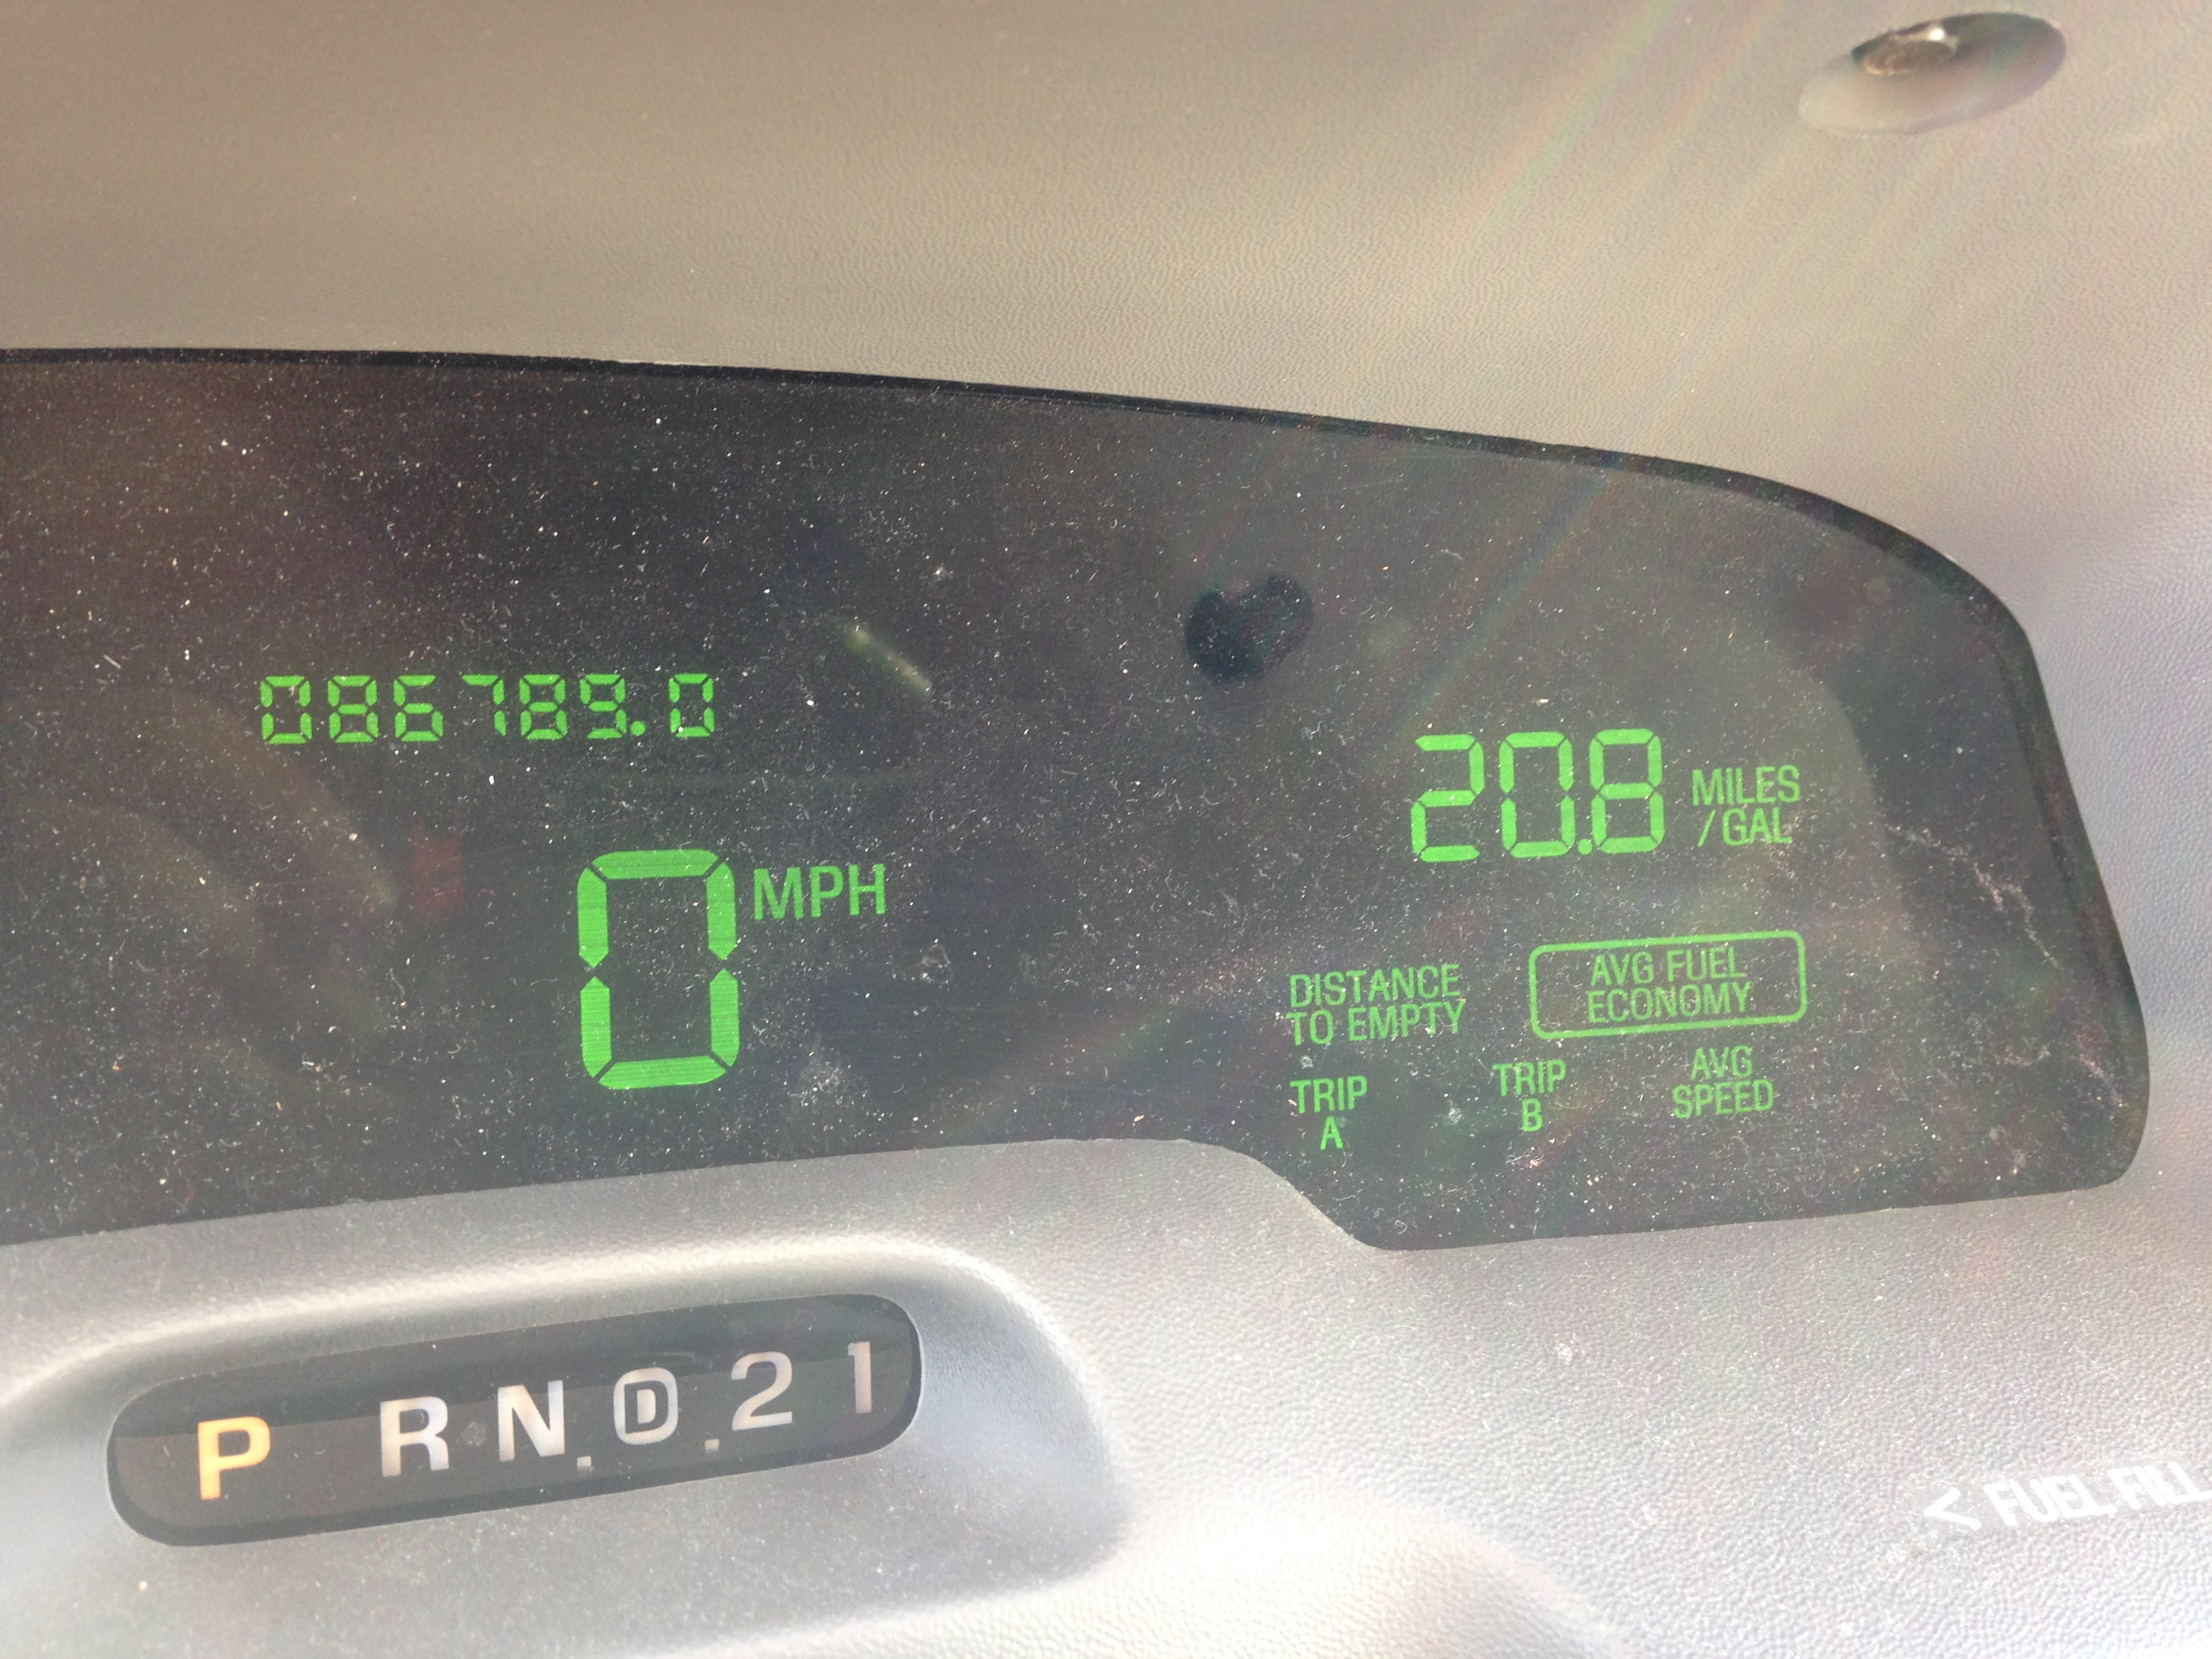
- My car has a digital read out with the average fuel economy. I used to have a car which also had the instantaneous fuel economy.
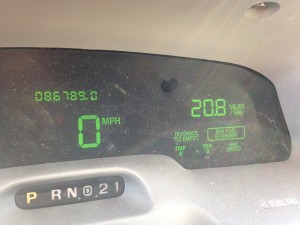
What is the difference between these two fuel economies? Under what circumstances is each more useful? How can I use the average fuel economy feature to approximate my instantaneous fuel economy? (Your answer should be 2-5 complete sentences).
- Read the article at
http://www.slate.com/blogs/bad_astronomy/2015/09/03/ice_loss_greenland_and_antarctica_lost_5_trillion_tons_since_1992.html .
You can use this QR code to access it

- Then answer the following questions. Give all answers in complete sentences with units.
- What is the average rate of change of the mass of Antarctica’s ice?
- What is the average rate of change of the mass of Greenland’s ice?
- Looking at the graphs, do you think it is reasonable to talk about the instantaneous rate of change for these quantities? Why or why not?
Jul 27
Here’s a warm up activity to get students thinking mathematically and thinking about what math is:
One of my friends posted this picture on Facebook. Use it and whatever other resources you need to answer the following questions.
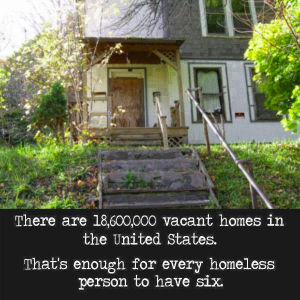
a) Assuming the first statement is correct, is the second statement correct?
b) What (if anything) is wrong with this “solution” to homelessness?
c) To what extent was this problem “doing math”? Were both parts a and b math problems?
Mar 23
Randall Munroe drew a lovely comic strip graphing the effects of proximity to a cat on the human intellect:

(You can view it here: http://xkcd.com/231/).
In differential calculus I asked students to describe the graphs using their knowledge of calculus. Statements about both the first and second derivative are expected.
In Intermediate Algebra here at UDM we study qualitative graphs, so I also asked my Algebra students to describe the graph. These students have to say things like the intelligence of the human is decreasing, but at an ever faster rate.
One caution with this comic: some students do not know what “inanity” means, so I use this problem on the review sheet rather than the exam.