Oct 30

One of the challenges in creating realistic problems for my students is finding good/interesting sources of data.  I will list here some useful site for finding data along with a brief description of the sorts of data one can find there.  I have to confess that this post is largely self-serving, providing me with a record of data sources I have heard of or used before.

Data.gov is “the home of the US Government’s open data.”  There are over 300,000 data sets, for example Chicago crimes from 2001 to the present and national hourly precipitation data. 

Data.detroitmi.gov is a data base of information on the city of Detroit.  Information includes government data, public health data, and education data.

data.nasa.gov is NASA’s data base which includes climate change data.

http://mlb.mlb.com/stats/sortable.jsp has the statistics of every major league  baseball player which can be sorted and filtered by things like team and position.

http://www.ncaa.org/about/resources/research/data-sharing is a source of data about NCAA teams/players.

https://www.cia.gov/library/publications/resources/the-world-factbook/ is the CIA’s “World Fact book” containg a wide variety of information on all the world’s countries from land area to GDP to major exports.

https://www.bls.gov/data/ the US Bureau of Labor Statistics.

https://pollingreport.com/ has results of American Opinion Polls.

World Values Survey https://www.worldvaluessurvey.org/wvs.jsp .

https://www.datafiles.samhsa.gov/data-sources (The Substance Abuse and Mental Health Data Archive).

https://data.cdc.gov/ Center for Disease Control.


Jul 27


Here is a problem I have used in my algebra class. It uses knowledge of lines, functions, and extrapolation versus interpolation.  (I find that in order for the students to be able to read the picture of the sign, I have to print it in color.  Next time I go to the zoo I am going to try to get a better picture.)

The sign shown below from the Detroit Zoo gives various information about giraffes.  Use the information from the sign to answer the following questions.


Giraffe

A) Write a function g(t) describing the height of a giraffe during its first year of life where t is the age of the giraffe in months.

B) How tall is a giraffe when it is one year old?  Give your answer in a complete sentence with units.

C) Compute g(-1).  Is this interpolation, reasonable extrapolation, or reckless extrapolation?

Jun 18

My son has a set of construction toys called K’nex.  In this problem I ask my Elementary Functions (Precalculus) students to think like the designers of these toys.  I have written two versions of this activity.  The file Knex-Pyth-Comp contains the pdf of both versions.  Contact me by email or on Twiter @ArcheyDawn if you would like the .tex file.  The file begins with a shared introduction.  Problem 1 (which can stand alone) is just one application of the Pythagorean Theorem plus a little thinking.  Problem 2 (which can stand alone) requires using the Pythagorean Theorem repeatedly, function composition, and (of course) thinking.


Introduction

The main pieces of the set are sticks of various lengths and connectors that look like gears to hook the sticks together. To make interesting shapes, several different sizes of sticks will be needed.  My son’s set of K’nex has 5 different lengths, pictured below.  From smallest to largest, they are black, yellow, gray, red, and purple.  When I do this problem with my class, I will bring the K’nex with me so that the students can measure and see if they are getting the correct answers.

KnexSmallSticks


One of the basic shapes that will be used by children to construct a variety of objects is an isosceles right triangle.  You can see an example of a bicycle built from K’nex in the picture below.  Notice the two isosceles right triangles making the frame of the bike.

KnexBike

Problem 1 (just uses Pythagorean Theorem)

If the length of the gray bars which will form the legs of the isosceles right triangle is 4.1 cm and if it is 0.6 cm from the end of the bar to the center of the connector (the vertex of the triangle), how long should the red bars be made which will form the hypotenuse of the triangle.  See the picture below for reference.

KnexGrayRed


Problem 2 (uses Pythagorean theorem and function composition)

Let x be the length of the legs of the smallest isosceles right triangle it will be possible to make with your construction toy.  These legs will consist of a black stick with a connector on each end.  The distance from the end of the stick to the center of the connector (the vertex of the triangle) is 0.6 cm.  The hypotenuse of this smallest triangle will consist of a yellow stick attached to the connectors.  See the picture below.  Give all answers in a complete sentence with units.

KnexBlackYellow

a)  (First lets try to design the set of toy’s the easy way.) The easiest thing to do would be to pick integer lengths for the lengths of the sticks.  Suppose the set of toys is manufactured so that the black sticks has length 2 and the yellow sticks have length 3.  Can an isosceles right triangle be built from such a set of toys?  Why or why not?

b) (Ok, so the easy way didn’t work.  For the rest of the worksheet, lets try being more careful.) What is the length of the black stick?  (Give a formula in terms of x).  For the rest of this problem, it will be important to keep track of whether we are discussing the length of a stick or the length of the whole side of the triangle.  You might find it useful to record your answers in the table included at the end of the worksheet so that you can refer back to them as you work.

c)  Give a function f(x) for the length of the hypotenuse of a triangle whose legs have length x.

d) Suppose you decide to make the black sticks 1.4 cm long.  What is the length of the legs of the isosceles right triangle that can be made with them as shown in the picture?  What is the length of the hypotenuse of that triangle?

e) Still supposing you decide to make the black sticks 1.4 cm long, what is the length of the hypotenuse of the triangle described in the previous problem? Compute the length of the hypotenuse in two ways and make sure you get the same answer both times.  %using f(x) and usin the Pythagorean theorem directly.

f)  Go back to assuming the length of the legs (built from black sticks) of the smallest triangle is the unknown x.  Recall that the length of the hypotenuse (built from a yellow stick) of this triangle is given by f(x).  Suppose you wanted to allow bigger isosceles right triangles to be built.  If the legs are built from yellow sticks, use the Pythagorean theorem to give a formula, in terms of x, for the length of the hypotenuse of the triangle with legs made from yellow sticks.  We will use gray sticks for this larger hypotenuse.  The following picture shows the whole set of possible isosceles right triangles.

KnexAllTriangles

g)  Compute $f \circ f (x)$ and compare your answer to the formula in the previous problem.  (You may need to do some simplification in order to compare well.)  Explain why any similarities you noticed make sense.

h) Suppose you want to make a third size triangle, this one with legs formed from the gray sticks and a hypotenuse which we will make red.  Does $ f \circ f \circ f (x) $ have any bearing on this problem, if so what?

i) Go back to assuming the black sticks will be 1.4 cm long?  How long will the gray sticks be?  How long will the red sticks be?

j)  Still assuming the black sticks are 1.4 cm long, how long will the hypotenuse be of the triangle whose legs are made from red sticks?  How long should we make the purple sticks we will use to form this hypotenuse?


KnexTable


May 18

This is a problem I normally give at the end of semester in calculus 1 as part of a worksheet composed entirely of application problems from various sections of the book (Some of the other problems from this worksheet appear else where in the blog.  Links to them are at the bottom of this post).  This kind of mixed review can be very powerful because the students have to figure out which of the many techniques they have learned apply to the situation.  This is a skill that employers recruiting at our university’s career fairs have told me the are seeking.  I include the references on the worksheet that I hand out, not just the questions.

A variation on this problem (using function composition and similar triangles instead of related rates) is suitable for use in a precalculus course.  The precalculus variation will be appearing as [4].


Here’s the problem:

(Hint: In this problem you need to be very careful with units). The Maldives is an example of a poor low-lying country which will be hit soon and hard by the effects of global climate change including sea level rise [3], [2].  The Maldives is located south-southwest of India.  It consists of approximately 1,190 islands and is the lwest country in the world with a maximum elevation of 2.4 m.  The Maldives has a total area of 298 km squared and a coastline of 644km [2].  Since the actual shape of the Maldives is complicated, we will use a simpler shape to compute with and assume this is a good stand-in for the real islands.  We will pretend the nation is one triangular prism as pictured below.  The width of the base is 1 km and the length of the base is 320 km.  The height of the prism is 2.4m.

a) Convert all units to kilometers and label the picture with the measurements in kilometers.  What is the map area of the prism in kilometers squared?   By map area, in this problem, we mean the area of the rectangle you would see by looking down on the prism from above.

SeaLevel-Prism

b) At what rate is the area changing when the elevation is 2meters if the sea level is rising at a rate of 4.3325 mm per year?

c) The Intergovernmental Panel on Climate Change (IPCC) predicts between 0.28 and 0.98 m of sea level rise by 2100 [1].  Some reputable sources predict up to 2 m of sea level rise  by 2100 [3].  What is the annual rate of sea level rise in mm per year for each of these estimates?  What is the rate of change of the area for each of these estimates?


References

[1] J. A. Church, et. al. “Sea Level Change“. In: Climate Change 2013: The Physical Science Basis. Contribution of Working Group I to the Fifth Assessment Report of the Intergovernmental Panel on Climate Change. Cambridge University Press, Cambridge, United Kingdom and New York, NY, USA. 2013.
Full text available at http://www.climatechange2013.org/images/report/WG1AR5\_Chapter13\_FINAL.pdf

[2] The CIA World Factbook, https://www.cia.gov/library/publications/the-world-factbook/geos/mv.html, accessed on May 6, 2015.

[3] K. Dow and T. E. Downing, The Atlas of Climate Change: Mapping the world’s greatest challenge, 3rd ed.
University of California Press, Berkeley,  2011.

[4] Archey, Dawn. “Sea Level Change and Function Composition.” In Mathematics and Social Justice Modules for the Classroom.  Eds. Karaali, Gizem and Khadjavi, Lily. to appear.


Other problems in the Calculus 1 mixed review worksheet included:

https://sites.udmercy.edu/archeyde/2015/04/13/limits-and-fairy-tales/


Jul 27

Here’s a warm up activity to get students thinking mathematically and thinking about what math is:

One of my friends posted this picture on Facebook.  Use it and whatever other resources you need to answer the following questions.

HomelessDivision

a) Assuming the first statement is correct, is the second statement correct?

b)  What (if anything) is wrong with this “solution” to homelessness?

c) To what extent was this problem “doing math”?  Were both parts a and b math problems?

Jan 06

Here are a few comic strips dealing with extrapolation.  Each is accompanied by a question I would ask students about the strip.

1) Explain this comic strip using knowledge from the course.

XKCD-HobbyExtrapolating

(This strip is by Randall Munroe and can be accessed at http://xkcd.com/605/)

2) Read this comic strip by Randal Munroe and answer the following questions.

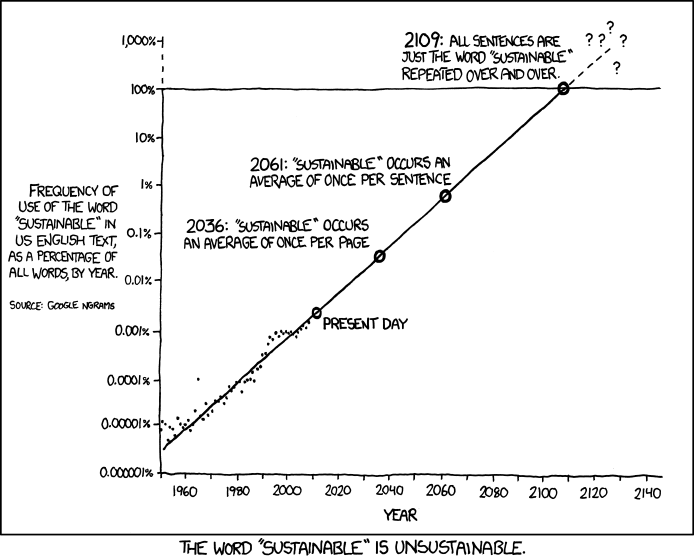
Sustainable

(This strip can be accessed at http://xkcd.com/1007/)

a) For which span of years does the Munroe have data on the frequency of the use of the word “sustainable”?

b) Munroe made a model of this data.  Does the model fit the data well?

c) Munroe used his model to predict the frequency of the word “sustainable” in 2061.  What percent of words does he predict will be ”sustainable” in 2061?  Is this an example of interpolation or extrapolation?  Is this prediction likely to be valid?

Dr. Dawn's blog