Aug 03

These are the slides for my talk at MathFest 2016.  MathFest2016Talk-AuthenticAppliedProblems-pdf.pptx

My talk was/will be on Saturday morning at 9:50 in Union A.  If you can/did make it, thank you.

If can’t make it, feel free to enjoy the slides anyway.

Jul 27


Here is a problem I have used in my algebra class. It uses knowledge of lines, functions, and extrapolation versus interpolation.  (I find that in order for the students to be able to read the picture of the sign, I have to print it in color.  Next time I go to the zoo I am going to try to get a better picture.)

The sign shown below from the Detroit Zoo gives various information about giraffes.  Use the information from the sign to answer the following questions.


Giraffe

A) Write a function g(t) describing the height of a giraffe during its first year of life where t is the age of the giraffe in months.

B) How tall is a giraffe when it is one year old?  Give your answer in a complete sentence with units.

C) Compute g(-1).  Is this interpolation, reasonable extrapolation, or reckless extrapolation?

Jun 20

Overview

This activity introduces children to the abstract concept of projections from 3 dimensional space onto 2 dimensional space in a concrete and age appropriate way by using rubbings of objects with interesting surfaces.  The activity is written for a Kindergarten class, but could easily be adjusted for other early elementary students.    The activity takes 30-50 minutes.  The main portion of the directions are below, but the full version is here: Rubbings as Projections (including the coin equation handout).

Large group Introduction

  1. Demonstrate how to take a rubbing (I used the bottom of my shoe)
  2. Discuss what information is preserved in the rubbing (tallest portions) and what is lost (color, how far down the lower parts are)
  3. Discuss three dimensions versus two dimensions. If you can only see one side of something, say the top, you don’t know very much about it.  Cone upside down looks the same as a cylinder from the top.  Cube and rectangular prism look the same from the top (if the rectangular prism is oriented correctly).  If you can only see my back, you don’t know how many buttons my shirt has.
  4. (optional) Show an object, have students predict what rubbing will look like, take the rubbing and discuss (possibly do this two or three times)
  5. Get out the matching cards (RubbingsAsProjections-MatchingCards). Pass out the pictures of the rubbings to groups of students Show the pictures of the objects one at a time on the Elmo/smart board/by holding them up.  Students should try to pick out the picture of the rubbing that goes with the object.  Here’s a sample pair:

2016-05-27 10.49.28 2016-05-27 10.49.12

Small group “centers” done in rotation (pick four to do-I think the first four are the best)

  1. Doing Rubbings-each student should make a rubbing of the bottom of their shoe.
  2. Tallest Portions-cut off and look at the tallest portions of Swiss Cheese, an apple, carrot with the greens still attached, angel food cake, loaf of bread, pear, or similar food objects. Draw a picture.  (“Remember a rubbing is basically taking the top layer of something, so at this station we are going to cut off the top layer of some food.” First I cut the top off the apple (using a kiddie safety knife), “what does this top layer tell us about the rest of it?”  Then used the corer slicer to cut the apple into 3 wedges which the students ate.  Then I help up a small piece of the carrot leaves.  “What do you think this is the top layer of?”  Students knew it was a plant, but didn’t know which one.  Then I got the carrot out of my bag and talked about how the top layer was very different from the main part. Some students wanted to try the carrot too.  For the Swiss cheese I used a package of thin sandwich slices, which I carefully stacked up into the original block they would have come from.
    2016-06-15 11.59.422016-06-15 11.59.22“What would it look like if I cut off the top layer of this?”  “Is this more like the apple or the carrot?”  Students also wanted to try the Swiss cheese.  I gave each only a quarter of a slice.  Many students didn’t like it, so I said to spit it out and congratulated them for trying something knew).
  3. Memory- Play concentration/memory with the matching cards. The matched pairs are the picture of the object and the picture of the rubbing.
  4. Coin equations-Rubbings of coins to make equations with gray and orange crayons-see attached handout.
  5. Rubbing Predictions-Given several interesting objects predict what the rubbings would look like and then take rubbings.
  6. Self Portrait—Have the students think about what their top layer is and the draw a picture of what they would look like as seem from above. It may help to have group members take turns sitting on the floor for a few seconds so others can see what they look like from that angle.  (My hunch is this is too hard for Kindergarten, but could work for older kids).
Jun 18

My son has a set of construction toys called K’nex.  In this problem I ask my Elementary Functions (Precalculus) students to think like the designers of these toys.  I have written two versions of this activity.  The file Knex-Pyth-Comp contains the pdf of both versions.  Contact me by email or on Twiter @ArcheyDawn if you would like the .tex file.  The file begins with a shared introduction.  Problem 1 (which can stand alone) is just one application of the Pythagorean Theorem plus a little thinking.  Problem 2 (which can stand alone) requires using the Pythagorean Theorem repeatedly, function composition, and (of course) thinking.


Introduction

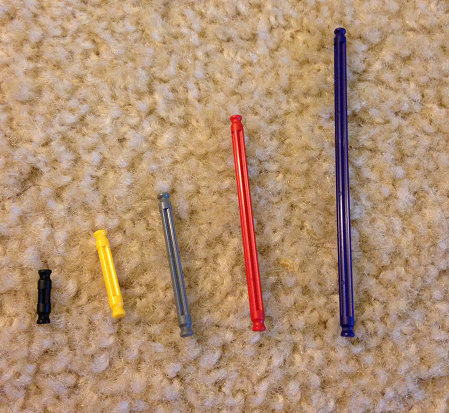
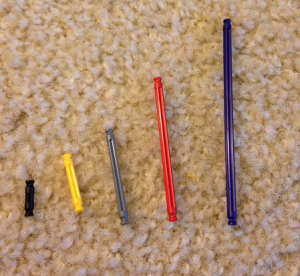
The main pieces of the set are sticks of various lengths and connectors that look like gears to hook the sticks together. To make interesting shapes, several different sizes of sticks will be needed.  My son’s set of K’nex has 5 different lengths, pictured below.  From smallest to largest, they are black, yellow, gray, red, and purple.  When I do this problem with my class, I will bring the K’nex with me so that the students can measure and see if they are getting the correct answers.

KnexSmallSticks


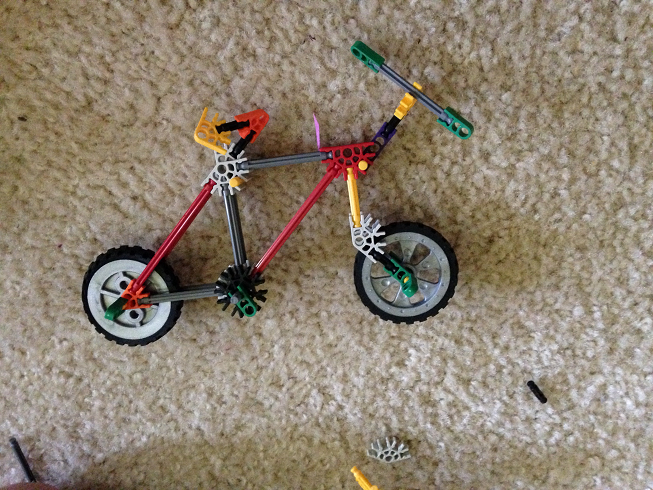
One of the basic shapes that will be used by children to construct a variety of objects is an isosceles right triangle.  You can see an example of a bicycle built from K’nex in the picture below.  Notice the two isosceles right triangles making the frame of the bike.

KnexBike

Problem 1 (just uses Pythagorean Theorem)

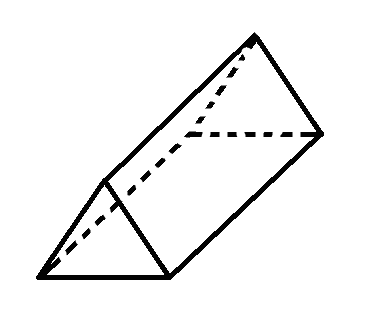
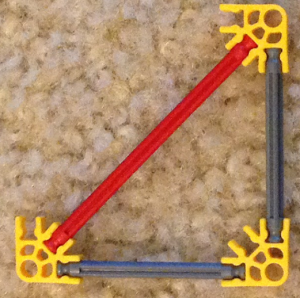
If the length of the gray bars which will form the legs of the isosceles right triangle is 4.1 cm and if it is 0.6 cm from the end of the bar to the center of the connector (the vertex of the triangle), how long should the red bars be made which will form the hypotenuse of the triangle.  See the picture below for reference.

KnexGrayRed


Problem 2 (uses Pythagorean theorem and function composition)

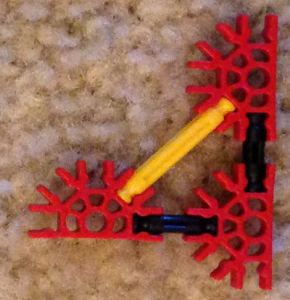
Let x be the length of the legs of the smallest isosceles right triangle it will be possible to make with your construction toy.  These legs will consist of a black stick with a connector on each end.  The distance from the end of the stick to the center of the connector (the vertex of the triangle) is 0.6 cm.  The hypotenuse of this smallest triangle will consist of a yellow stick attached to the connectors.  See the picture below.  Give all answers in a complete sentence with units.

KnexBlackYellow

a)  (First lets try to design the set of toy’s the easy way.) The easiest thing to do would be to pick integer lengths for the lengths of the sticks.  Suppose the set of toys is manufactured so that the black sticks has length 2 and the yellow sticks have length 3.  Can an isosceles right triangle be built from such a set of toys?  Why or why not?

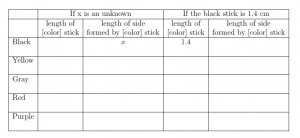
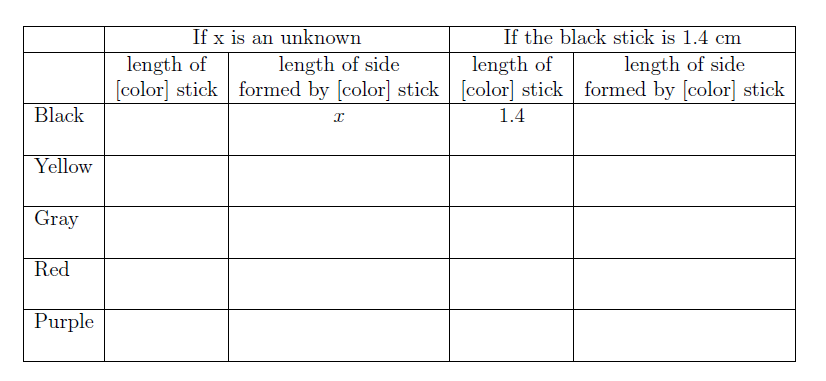
b) (Ok, so the easy way didn’t work.  For the rest of the worksheet, lets try being more careful.) What is the length of the black stick?  (Give a formula in terms of x).  For the rest of this problem, it will be important to keep track of whether we are discussing the length of a stick or the length of the whole side of the triangle.  You might find it useful to record your answers in the table included at the end of the worksheet so that you can refer back to them as you work.

c)  Give a function f(x) for the length of the hypotenuse of a triangle whose legs have length x.

d) Suppose you decide to make the black sticks 1.4 cm long.  What is the length of the legs of the isosceles right triangle that can be made with them as shown in the picture?  What is the length of the hypotenuse of that triangle?

e) Still supposing you decide to make the black sticks 1.4 cm long, what is the length of the hypotenuse of the triangle described in the previous problem? Compute the length of the hypotenuse in two ways and make sure you get the same answer both times.  %using f(x) and usin the Pythagorean theorem directly.

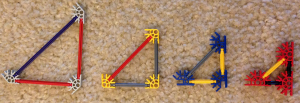
f)  Go back to assuming the length of the legs (built from black sticks) of the smallest triangle is the unknown x.  Recall that the length of the hypotenuse (built from a yellow stick) of this triangle is given by f(x).  Suppose you wanted to allow bigger isosceles right triangles to be built.  If the legs are built from yellow sticks, use the Pythagorean theorem to give a formula, in terms of x, for the length of the hypotenuse of the triangle with legs made from yellow sticks.  We will use gray sticks for this larger hypotenuse.  The following picture shows the whole set of possible isosceles right triangles.

KnexAllTriangles

g)  Compute $f \circ f (x)$ and compare your answer to the formula in the previous problem.  (You may need to do some simplification in order to compare well.)  Explain why any similarities you noticed make sense.

h) Suppose you want to make a third size triangle, this one with legs formed from the gray sticks and a hypotenuse which we will make red.  Does $ f \circ f \circ f (x) $ have any bearing on this problem, if so what?

i) Go back to assuming the black sticks will be 1.4 cm long?  How long will the gray sticks be?  How long will the red sticks be?

j)  Still assuming the black sticks are 1.4 cm long, how long will the hypotenuse be of the triangle whose legs are made from red sticks?  How long should we make the purple sticks we will use to form this hypotenuse?


KnexTable


May 18

This is a problem I normally give at the end of semester in calculus 1 as part of a worksheet composed entirely of application problems from various sections of the book (Some of the other problems from this worksheet appear else where in the blog.  Links to them are at the bottom of this post).  This kind of mixed review can be very powerful because the students have to figure out which of the many techniques they have learned apply to the situation.  This is a skill that employers recruiting at our university’s career fairs have told me the are seeking.  I include the references on the worksheet that I hand out, not just the questions.

A variation on this problem (using function composition and similar triangles instead of related rates) is suitable for use in a precalculus course.  The precalculus variation will be appearing as [4].


Here’s the problem:

(Hint: In this problem you need to be very careful with units). The Maldives is an example of a poor low-lying country which will be hit soon and hard by the effects of global climate change including sea level rise [3], [2].  The Maldives is located south-southwest of India.  It consists of approximately 1,190 islands and is the lwest country in the world with a maximum elevation of 2.4 m.  The Maldives has a total area of 298 km squared and a coastline of 644km [2].  Since the actual shape of the Maldives is complicated, we will use a simpler shape to compute with and assume this is a good stand-in for the real islands.  We will pretend the nation is one triangular prism as pictured below.  The width of the base is 1 km and the length of the base is 320 km.  The height of the prism is 2.4m.

a) Convert all units to kilometers and label the picture with the measurements in kilometers.  What is the map area of the prism in kilometers squared?   By map area, in this problem, we mean the area of the rectangle you would see by looking down on the prism from above.

SeaLevel-Prism

b) At what rate is the area changing when the elevation is 2meters if the sea level is rising at a rate of 4.3325 mm per year?

c) The Intergovernmental Panel on Climate Change (IPCC) predicts between 0.28 and 0.98 m of sea level rise by 2100 [1].  Some reputable sources predict up to 2 m of sea level rise  by 2100 [3].  What is the annual rate of sea level rise in mm per year for each of these estimates?  What is the rate of change of the area for each of these estimates?


References

[1] J. A. Church, et. al. “Sea Level Change“. In: Climate Change 2013: The Physical Science Basis. Contribution of Working Group I to the Fifth Assessment Report of the Intergovernmental Panel on Climate Change. Cambridge University Press, Cambridge, United Kingdom and New York, NY, USA. 2013.
Full text available at http://www.climatechange2013.org/images/report/WG1AR5\_Chapter13\_FINAL.pdf

[2] The CIA World Factbook, https://www.cia.gov/library/publications/the-world-factbook/geos/mv.html, accessed on May 6, 2015.

[3] K. Dow and T. E. Downing, The Atlas of Climate Change: Mapping the world’s greatest challenge, 3rd ed.
University of California Press, Berkeley,  2011.

[4] Archey, Dawn. “Sea Level Change and Function Composition.” In Mathematics and Social Justice Modules for the Classroom.  Eds. Karaali, Gizem and Khadjavi, Lily. to appear.


Other problems in the Calculus 1 mixed review worksheet included:

https://sites.udmercy.edu/archeyde/2015/04/13/limits-and-fairy-tales/


Sep 22

Here are two problems I used in my calculus 1 class, just after teaching them the definition of the derivative and discussing average and instantaneous rates of change.


  1. My car has a digital read out with the average fuel economy.  I used to have a car which also had the instantaneous fuel economy.
    AverageFuelEconomy
    What is the difference between these two fuel economies?  Under what circumstances is each more useful?  How can I use the average fuel economy feature to approximate my instantaneous fuel economy?  (Your answer should be  2-5 complete sentences).
  2. Read the article at
    http://www.slate.com/blogs/bad_astronomy/2015/09/03/ice_loss_greenland_and_antarctica_lost_5_trillion_tons_since_1992.html .
    You can use this QR code to access it
    QR-code-ice-melt

    1. What is the average rate of change of the mass of Antarctica’s ice?
    2. What is the average rate of change of the mass of Greenland’s ice?
    3. Looking at the graphs, do you think it is reasonable to talk about the instantaneous rate of change for these quantities?  Why or why not?
      Then answer the following questions. Give all answers in complete sentences with units.


Jul 27

I was so excited about New Horizon’s fly by of Pluto, that I decided to create some math problems about it.  Here they are.  The first one uses the concepts of percent change and volume of a sphere.  The second two use right triangle trigonometry.


1) Answer the question posed in @MathInTheNews ‘s tweet from July 14, 2015:
New Horizons says Pluto’s diameter is 1473mi, 50mi larger than believed. What % does that change its volume estimate?

PlutoBigger

(Yes, the picture was part of the tweet)

2) Pick two mountains in the large picture of Pluto.  The angle of elevation from the tip of the mountain’s shadow to the tip of the mountain is approximately y/736.5 radians where y is the distance in miles from the base of the mountain to the edge of Pluto in the picture.

a)  What is the height of each of your two mountains?

b) How precise do you think our method is?

c)  Do you think NASA’s claim that there are 11,000 ft high mountains on Pluto is credible?

(Note to other instructors, the estimation of the angle given above is very imprecise, so the students ended up finding mountain heights no more than 7,000 feet high.  In order to improve precision, I printed the following picture out as a 11 by 17 picture).

PlutoMountains


3) In a July 13, 2015 article for Reuter’s Irene Klotz wrote, “Mysterious Pluto looms large and turns out to be larger than expected as NASA’s New Horizons spacecraft wraps up a nearly decade-long journey, with a close flyby on track for Tuesday, scientists said on Monday.  The nuclear-powered probe was in position to pass dead center of a 60-by-90-mile (97-by-145 km) target zone between the orbits of Pluto and its primary moon, Charon, at 7:49 a.m. EDT (1149 GMT) on Tuesday, said managers at New Horizons mission control center, located at the Johns Hopkins University Applied Physics Laboratory outside of Baltimore. After a journey of 3 billion miles (4.88 billion km), threading that needle is like golfer in New York hitting a hole-in-one in Los Angeles, project manager Glen Fountain told reporters.”

Is this analogy correct?  (You will need to look up some additional numbers and make additional assumptions to answer this question).

Jul 27

Here’s a warm up activity to get students thinking mathematically and thinking about what math is:

One of my friends posted this picture on Facebook.  Use it and whatever other resources you need to answer the following questions.

HomelessDivision

a) Assuming the first statement is correct, is the second statement correct?

b)  What (if anything) is wrong with this “solution” to homelessness?

c) To what extent was this problem “doing math”?  Were both parts a and b math problems?

Jul 07

This is a problem I work through in my pre-calculus class when we are discussing the meaning of the slope and y-intercept.  It also gives me the opportunity to discuss the perils of extrapolating far outside of the data set.

Consider the following data and the linear model that fits it.

CO2vsTemp

The equation for the linear model is y=0.019x+4.76.  Answer the following questions in complete sentences with units.

  1. What are the units for the slope?
  2. What does the slope mean in this particular situation?
  3. What are the units for the y-intercept?
  4. What does the y-intercept mean in this particular situation?

(data from http://www.esrl.noaa.gov/gmd/dv/data/index.php?site=mlo&parameter_name=Carbon%2BDioxide&frequency=Monthly%2BAverages and http://www.ncdc.noaa.gov/cag/ )

Apr 13

The FoxTrot Strip from November 6, 2005 contained a “numerical word search”

You can find the strip here.

There are seven clues which are arithmetic problems, but there is also the derivative of 43981 x , the definite integral of x^3 from 0 to 16, and the sum from k equals 0 to 47 of k squared.    I asked my calculus students to perform all these calculations.

Dr. Dawn's blog